Fighting the Tech Instead of Closing the Deal
How a Service-AI framework gave Docusign's sales team back 85,000 hours a year, without hiring a single new person.
Role
Experience Architect & Design Lead
Global Users
1,750
Quotes Generated
13,126
Annual Hours Saved
85,000+
Projected Rev. Uplift
$10–15M
Published
DMI ADMC 2026Highly Skilled People Doing Clerical Work
Early in the research phase, I asked an Account Executive to walk me through how he built a quote. He pulled up his screen: not the quoting tool, but a Google Sheet. A sprawling, hand-crafted spreadsheet with colour-coded cells, formulas held together by hope, and data manually copied from a CRM open in another tab.
He shrugged and said something I've thought about many times since: “We spend more time fighting the tech than actually selling.”
The numbers backed him up. Research confirmed that Account Executives (AEs) and Customer Success Account Managers (CSAMs) were spending 40 to 70% of their time on non-revenue-generating administrative work. Building a single quote could take up to an hour. For every rep. Every opportunity. Every day.
Three structural failures defined the crisis:
- Cognitive overload by design. Reps toggled between CRM systems, email threads, analytics dashboards, and spreadsheets, sometimes ten open tabs simultaneously, just to assemble the data needed to price a single renewal.
- Abandoned automation. The official quoting tool wasn't being avoided because it couldn't do the job. It was being avoided because using it felt worse than doing the job manually.
- A creativity ceiling on complex deals. Non-standard deal structures required workarounds the system was never designed to support, actively preventing the most strategic selling.
Quantitative analysis reinforced the qualitative picture: 71% of quotes required more than one configuration, extreme cases exceeded ten, and the average time from “Configure Products” to “Finalize” was 12 minutes, before counting the spreadsheet work happening outside the system entirely.
The Research Question
This wasn't a redesign problem. It was a human-AI design problem.
The central question guiding the work: how can enterprise systems leverage AI to restore human agency without creating a dangerous black-box dependency?
The goal was not to automate sales. It was to design a symbiotic system where AI absorbed the high-velocity data work that burned reps out, while humans retained full authority over the strategic decisions that required judgment, relationships, and accountability. Machine logic at scale. Human empathy at the moment of truth.
Discovery and Journey Mapping
We started where every good design process starts: with the people doing the work.
I facilitated persona-led contextual inquiry workshops with 18 participants spanning the full Quote-to-Cash lifecycle. Account Executives handling new business, AEs managing install base, CSAMs, Deal Desk specialists, and Revenue Operations. We gathered over 550 observational notes and mapped friction points with surgical precision.
The findings were stark. Participants were spending up to 70% of their time on manual estimates built in Google Sheets, complex custom spreadsheets that lived entirely outside the official quoting system, before migrating data into CPQ tools as a final step. The official system wasn't the workflow. It was the export destination.
The Journey Map exercise was our shared reckoning. Printed and assembled for cross-functional review, it made visible for the first time the full arc of a sales rep's experience, including the unexpected hot spots where frustration peaked and workarounds proliferated. It created the shared understanding that made every subsequent design decision possible.
Experience Architecture
Qualitative research tells you where the pain lives. Data tells you how much it costs.
We analyzed 350,000 historical sales opportunities to identify the highest-leverage points for cognitive relief: the moments in the quote-building process where AI assistance could deliver the most time savings with the least disruption to user control.
From this analysis, I defined the Service-AI framework, a three-pillar operating model built to replace the linear, tightly-coupled logic of legacy SaaS platforms:
- Orchestration. The AI acts as a synthesis engine, pulling real-time consumption data, historical contracts, and customer intelligence from disparate systems through a standardized MCP layer, eliminating the need for custom integrations at every touchpoint.
- Execution. The Quick Quote interface enables rapid, iterative deal modelling. Prompt caching and stack-agnostic optimizations reduce latency by up to 80%, keeping the interface responsive during complex multi-variable configurations.
- Human Override. The critical layer. The framework treats the generative model as a “Strategic Co-pilot” rather than an autonomous underwriter, the rep reviews, adjusts, approves, and owns every customer-facing artifact the system generates.
Those three pillars didn't stay abstract for long. They decomposed into five foundational architecture decisions, the load-bearing pieces that every subsequent screen and workflow had to respect.
Together, the pillars and the capabilities they enabled resolved into a single Experience Architecture blueprint, the artifact that aligned engineering constraints, business requirements, and user needs into one shared reference for every design and build decision that followed.
Choosing the Design System. Speed forced an honest infrastructure decision. We began with Docusign's own INK Design System, but component requirements were outpacing what it could supply at the velocity we needed. We assessed several open-source systems, including Salesforce Lightning, and adopted IBM's Carbon Design System for its flexibility and component depth. Pragmatism over pride: the right foundation mattered more than the in-house one.
Pretotyping and Usability Validation
Validation ran across three distinct rounds, each testing a more finished version of the product against real user behaviour.
Round 1 — Early concept validation. Figma-based pretotypes with 9 participants, probing reactions to AI-generated suggestions, one-click proposal generation, and human-override controls, roughly 400 observational notes. Four core themes surfaced: Efficiency & Automation, Strategic Enablers, Customization, and Transparency & Control.
Round 2 — MLP validation. Prototype testing with 5 participants against the near-final feature set. Average rating: 9.5/10 on likelihood to use.
Round 3 — Usability testing. 1-on-1 sessions in a staged sandbox with 7 participants, evaluating a functional build, not a prototype, to ensure findings reflected real system behaviour. The baseline quoting experience scored 1.6 out of 4. Users described the legacy tool as slow, data-sparse, and built around “spiderweb reporting.” After engaging with Quick Quote, scores rose to 3.1 out of 4, with information consolidation into a single, intelligent view cited as the defining improvement.
The Design Decisions That Made It Work
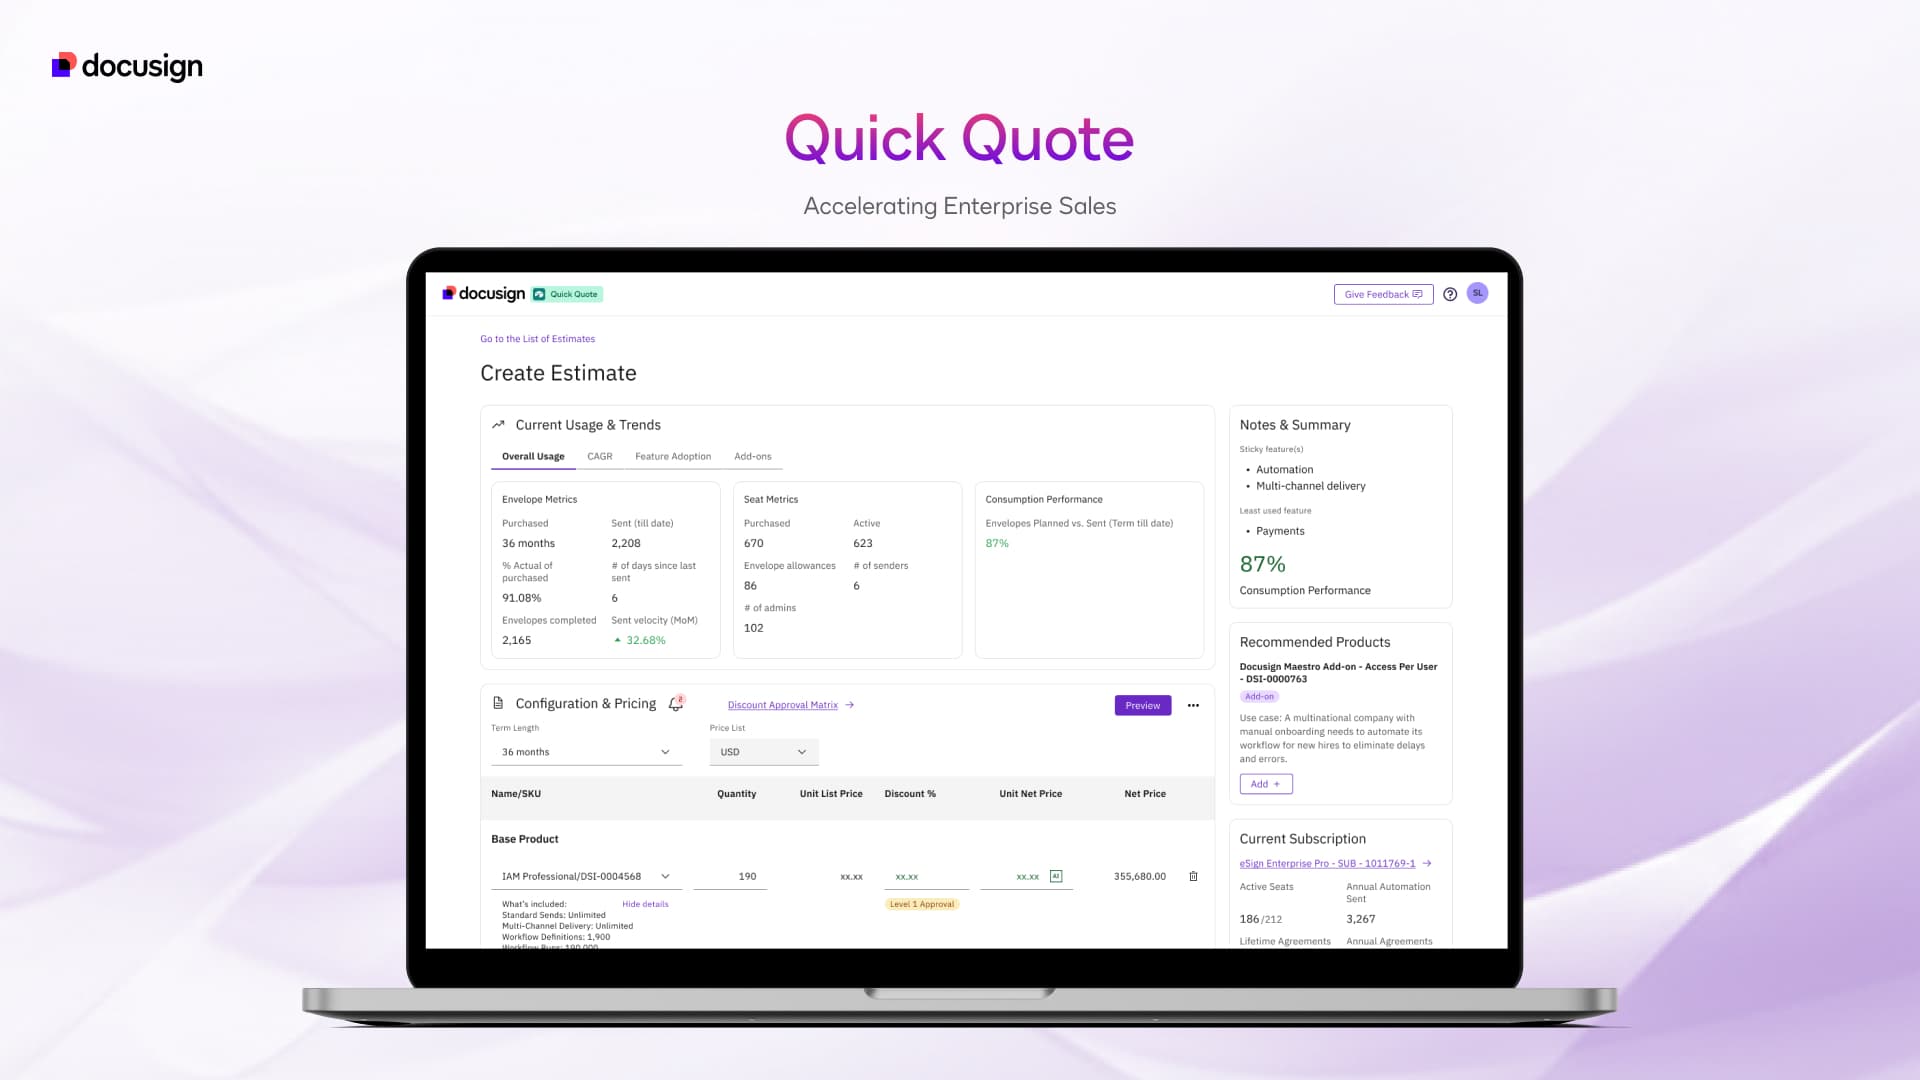
A single pane instead of ten tabs. Previously, assembling data for a single quote meant checking information across 10 browser tabs and copying it manually. Quick Quote collapsed that fragmentation into a unified data pane that automatically calculated discounts and net prices on data entry. The Usage Trends module (consistently the most praised feature in research) integrated consumption data, feature adoption rates, and sticky features into one clear view. For the first time, reps could walk into a renewal conversation with the customer's full story already in front of them.
One click from data to proposal. A single complex proposal could previously take hours: pull data from one source, pricing from another, paste into Google Slides, format, check, re-check. Quick Quote's one-click proposal generation collated data from multiple sources and assembled a customer-ready presentation automatically, correctly formatted, factually grounded, and fully editable before sharing. The Clone and Modify feature extended this further, enabling side-by-side scenario modelling with instant price delta visualisation. What once required Revenue Operations intervention now took seconds.
Making AI recommendations explainable. The initial interface flagged AI-generated pricing recommendations with a standard information icon and a tooltip. In research sessions, we noticed users hesitated. They wouldn't present an AI-recommended discount to a client without understanding how it was calculated. We replaced the generic tooltip with a dedicated AI explanation component: a prominent panel that expanded on interaction to show the exact reasoning behind every recommendation, historical deal benchmarks, similar customer data, and the specific variables that influenced the suggested discount. Users who had hesitated shifted to using AI recommendations confidently as a starting point for client conversations. That change in behaviour was small to build and significant to witness.
From Pilot to Global Rollout
The Pilot (Nov 2025 – Feb 2026). We released the Minimum Lovable Product, deliberately not an MVP; the bar was lovable, not merely viable, to 37 pilot participants across the US and LATAM. In one month, pilot users loaded 111 unique opportunities, created 438 estimates, converted 109 into quotes, and generated 52 automated proposal decks. Satisfaction averaged 9.5/10, 57% of pilot users actively adopted the tool, and the phase pressure-tested backend stability before wider release. One participant called the interface “pretty life changing.” Another, reflecting on the legacy system: “If I never have to see it again... I'm sold.”
Enablement as a Design Discipline. Rollout was designed, not announced. We partnered weekly with the Enablement team and, critically, championed pilot-phase AEs and CSAMs to tell their own story to the field, rather than the product team telling it for them. The field reaction told us it worked:
- “I literally just made a quote in 5 seconds when historically I have put off that step until the last minute because it could easily take me 15 min.”
- “Honestly the BEST update we had in our overall business process since I started this role.”
- “Besides ramp contracts, curious why anyone would use Apttus instead of Quick Quote?”
Global Scale (Mar – Jun 2026). Quick Quote launched to 697 North America users in March 2026, announced at Sales Kick-off, then expanded to EMEA and APJ in April and LATAM in May, reaching 1,750 active global users. The telemetry validated the framework at enterprise scale:
- 13,126 total quotes generated through Quick Quote (Apr 1 – Jun 3, 2026)
- 71% of eligible on-time renewal quotes flowed through the new system
- By the final week of May, Quick Quote overtook the legacy CPQ as the majority path, 53.6% vs. Apttus's 46.4%, inverted from 12.3% in week one
- 67% of all human-generated quotes are now eligible for Quick Quote, with releases targeting 90%
Time-motion analysis projects 85,000+ annual hours saved, the equivalent of 82 FTEs added without a single hire, restoring two full weeks of productivity per rep per year (54 weeks of output in a 52-week year), with a projected $10–15M in incremental revenue from the same team.
Regional telemetry now drives the roadmap: higher adoption in Commercial vs. Enterprise matched expectations (higher volume, lower complexity), while APJ friction surfaced localization needs, pricing uplift handling, backdating, credit calculators, already in development. The rollout didn't end the research; it industrialized it.
Published Research
The work was peer-reviewed and published as “A Service-AI Framework for Human-Centered Design in Enterprise Sales: Orchestration, Execution, and Roll Out” (Deshpande & Li) in the proceedings of the 25th DMI: Academic Design Management Conference, hosted at Georgia Tech, Atlanta, August 11–12, 2026, in the Design for AI and Technology track, which Parag also co-chaired. The paper situates Quick Quote within human-automation theory (Parasuraman & Riley's misuse/disuse framework, Shneiderman's Human-Centered AI, distributed cognition) and formalizes the Service-AI framework as a replicable model for other high-stakes, document-heavy domains such as legal contracting and procurement.
What I Learned
The workaround is the research finding. When sophisticated professionals build parallel systems in Google Sheets to bypass official tools, that's not user error. It's a signal that the official system has failed them. The workaround reveals what the product should have been. Starting there, instead of starting with the existing product, changes everything.
AI's job is to restore agency, not replace it. The most important design constraint in this project wasn't technical. It was philosophical. Every feature was evaluated against one question: does this give the human more control over the outcome, or less? Systems that answer “less” erode trust over time, regardless of their accuracy.
Explainability is a feature, not a footnote. The tooltip-to-explanation-card shift was a small design change that produced a significant behavioural change. Users don't resist AI recommendations because they distrust AI. They resist them because they can't defend them to a client. Make the reasoning visible, and the resistance disappears.
Lovable is a higher bar than viable, and worth it. The deliberate choice to target a Minimum Lovable Product shaped every prioritisation decision. The difference showed up in the 9.5/10 satisfaction score and in users describing the tool as “life changing.” Viability ships. Lovability gets evangelised.
Research continuity changes the product. The features users needed most (advanced usage tracking, CAGR metrics, collaborative approval workflows) weren't in the original roadmap. They emerged from the field. A design process that treats launch as the end of listening will always be building the wrong version of the thing.
Research rigor changes the organization, not just the product. Internal tools historically followed a rushed, engineering-first trajectory, two or three interviews, then build. This project ran five-plus rounds of research, 52+ participants, and over 2,000 minutes of interview time across the full lifecycle. The lasting artifact isn't only Quick Quote; it's a design culture where the field's voice reshapes the roadmap continuously. When users asked for CAGR metrics and usage tracking, those went back to the drawing board and shipped. That cadence is now the expectation, not the exception.